NDCs, latest update… The Planet will lose 3 kgs but needs to lose at least another 19 kgs…

The UNFCCC has released its full NDC synthesis report last Friday, 17th of September 2021. Whilst in the previous report only 113 parties had updated or submitted its NDCs targets, which corresponded to 49% of Global GHG emissions, the latest report shows that until 31st of July 2021, all parties had submitted their NDCs. A great progress has been done, as the call on my article from 31st of July.

Implementing those targets requires a collaborative effort, not always well received in spite of the common good all benefit from. The complexity of the system, given the underlying multiple interests and values makes the implementation an odyssey. The seas, currents and waves, through which the Sustainable transformation has been navigating, will take the Planet, Society, Businesses and Governments to lasting Prosperity, as long as compliance is a good practice. The commitments that parties have taken are summarised below in the graphical representation I’ve created.

NDCs implementation commitments as of latest updates from July 31st 2021.

According to the full NDC synthesis report, most of the parties expect to transit to a decarbonised economy between 2025 and 2030. But as “most” ranges between 41% and 70%, achieving Carbon Neutrality by 2030 and Net-Zero by 2050 has a high variability. To keep in the 1.5ºC global warming trajectory, a 45% reduction on global GHG emissions from 2010 levels by 2030 is requested (AR6). As such, high variability in the commitments makes me forecast dark and heavy skies ahead.

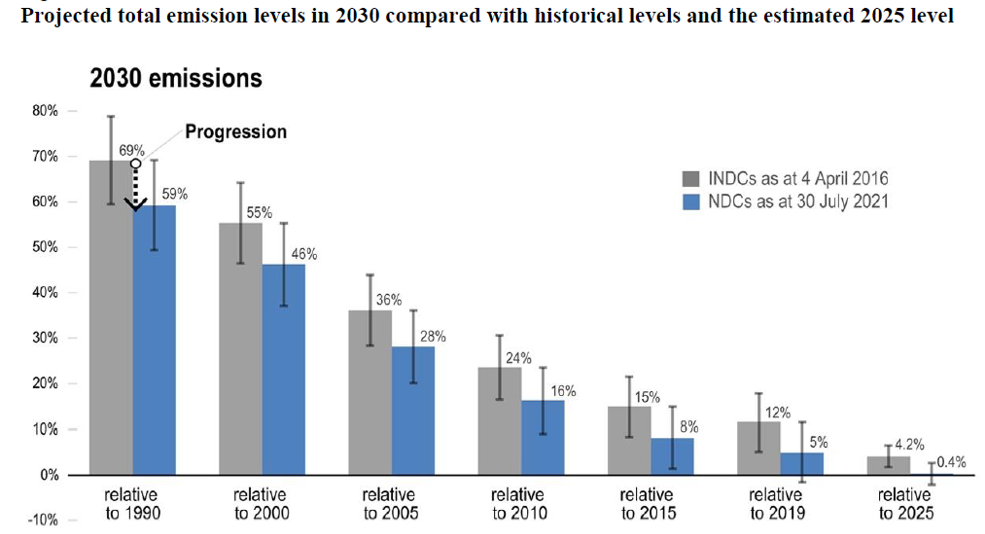
This landscape is easily seen on the below progression chart, “Projected total emissions levels in 2030 compared with historical levels and the estimated 2025 level”, was extracted from the report. Although a progress has been made in 8 percentage points, from the NDCs presented in 2016, alignment with 1.5ºC global warming pathway demands a 52.5% cut on GHG emissions from the latest NDCs. Reaching 26.02 GtCO2eq, implies a sustainable transformation in the economy, only achieved with a common effort as #weareallinthistogether. Many factors will contribute to the full economic decarbonisation. Innovation, collaboration, capital allocation to sustainable investments, policies and regulatory frameworks that enable a just transition, along with a clear strategy and roadmap will be key.

“Projected total emissions levels in 2030 compared with historical levels and the estimated 2025 level” 2016 vs 2021 NDCs GHG emissions level relative to historic values.
Quercus faginea, a gift to remind electors on the reforestation promises of a local government political party to the local government elections, to be held soon in Portugal.
Quercus faginea

The report does call for urgent bold actions, through different strategies: (1) overperforming current NDCs, (2) update the existent commitments or (3) a mix of overperforming with new extension of NDCs. It suggests material strategies to align with 1.5ºC pathway, namely the halt of coal related investments, a phased-out usage of fossil fuels passengers ICEV; newly constructed buildings net zero energy consumption by 2020 and expanding the forest area. The latter a measure some politicians aiming to win local governments elections are currently promoting in their campaign in Portugal.

As mentioned above in this article, the decarbonisation and consequent socio-economic sustainable transformation demands a significant allocation of capital. Changing finance policy to promote sustainable initiatives is thus imperative. Many central banks have started to take bolder actions to attain a sustainable transformation pushing through its monetary policy instruments. Commercial banks have been requested to conduct stress tests assessing their resilience to climate related risks, which increase as we approach the 1.5ºC trajectory sooner than expected, as IPCCC’s AR6 has recently shown. As it becomes inevitable, what are your thoughts on how to best contribute on the economic sustainable transformation? What actions have you been taking?

For many sustainability has been only a trend and #greenwashing an acceptable practice. Considering its negative effect on the sustainable transformation, could #greenwashing be penalised as negative externality? A proxy of the #opportunitycost and the #welfare loss it generates by not fully delivering the claimed sustainable value, would be a doable penalty to be paid by the #greenwashers. It would also constitute a revenue source to the national and supra-national public finances and be used for the NDCs’ implementation. Hence, the good players would be benefiting from a good behaviour while the free riders will face a lower incentive to cheat. With time, hopefully this extraordinary revenue will diminish.

How’s the New Year sustainable resolution? What has been of 2020? A mid-year review…

Just before we turned the calendar page to 2021 and amidst historical lockdown’s New Year celebrations across the planet, I wrote a small article titled Renewable Energy in 2020. It suggested potential New Year sustainable resolutions and wishes. The latter reflecting a NY’s tradition in both Portugal and Spain.

As we’re now in July, less than half-way through the end of 2021, it’s time to do a balance on how have we done so far with each one of our New Year sustainable resolutions. In a mid-year performance review style! Have you done yours? There’s still time for correction and stop those extra unsustainable behaviours, so you can be right back on track!

The first of my 2021 wishes, clearly didn’t materialise. Across the world many countries have been re-entering lockdowns due to new outbreaks, driven by Sars-Covid2 mutations spreading faster and with higher lethal risk as the Delta variant. Although some countries have been speeding up vaccination, increasing the immunity of its population, it hasn’t been enough. As of July 29th, the UAE is the country with highest percentage of inoculation, 79.3% with at least 1 dose and 70.8% of fully vaccinated population, according to the FT. Worldwide, the FT shows that 4.1 bn of vaccines doses have been given. Israel was the fastest country to reach 100 doses per 100 residents, doing so by mid-March. Second to Israel was the UK, achieving so by mid-June. According to Reuters, the inoculation speed prize for countries with a population over 1 million is now held by Ecuador with 1446 doses per 100k people. By October 2021 the FT estimates 5 billion doses could be administered with a likelihood just over 70%.

My second wish, has a brighter outcome. Climate Action has improved in 2020.

Arouca Unesco Global Geopark by Filipa Ferreira

 In terms of business and governmental actions, what has been done?

  1. Energy transition is occurring. Worldwide renewable installed capacity has increased by 2 percentage points in the total electricity generation installed capacity. In 2020 261 GW were added, reaching 36.6%, according to IRENA. South America is leading with 67.8%, Europe follows with 49.8% and Oceania with 46%. The latter is the continent with fastest growth, 4 p.p. from previous year. In terms of demand, IEA shows that renewable energy grew by 3% in 2020 reverting the overall contraction on electricity demand, that was induced by Covid-19 pandemic’s output restrictions.
  2. The USA is committed again with the Paris Agreement, officially back in 2021.
  3. NDCs have been partially delivered. 2020 was the deadline for the Paris Agreement signatories to submit or update its Climate-Action plans, 40% of the parties representing 30% of global GHG emissions have done so with the majority expecting to do so throughout 2021. The new commitments have increased coverage of the parties’ GHG emissions to 99.2%. Some have already started implementing their action plans, others set 2021 as the kick off year. The UNFCCC estimates that the current plans are insufficient to meet the Paris agreement goal of limiting global warming to 1.5ºC by 2030. GHG emissions are expected to reduce by 0.7% in 2030 in comparison to 2010, yet 45% reduction is needed. The remaining 60% needs to present and implement its Climate-Action plan urgently.
  4. Corporate Sustainability reporting has increased, but not all show the joint commitments requested to limit global warming to 1.5 ºC – 2ºC by 2030. More companies have signed pledges to do so and made public commitments to decarbonise its activities. Zero taskforces have been set up, to push industries to take bolder actions to decarbonise its sector. It’s a good step, we all would be much better if more embrace so and more material commitments are made, too.
  5. Climate risk is increasingly part of central banks stress testing. Sustainability compliance is becoming now a criterion to be financed across the whole finance value chain.

With COP26 expected to be held in Glasgow in November, what is being done? Some examples:

  1. Alok Sharma, COP26 president has been pushing for bolder commitments across the globe.
  2. The EU has approved its Climate Act and among other measures banned the Top 10 single-use plastic goods of Ocean leakage – cutlery, plates, cups and lids, straws, bottles and caps, food and beverage containers, lightweight plastic bags, cotton bud, tampons applicators, pads, balloons plus its sticks and fishing gear containing plastic. As of July 3rd, they no longer can be transacted. The expected impact of this ban is a 50% reduction on Ocean’s leakage, avoided annual emissions of 3.4 million CO2, and savings of Euros 6.5 billion of consumers’ annual budget. Hopefully the existent stock won’t end up in the Ocean.
  3. Sectoral Engagement is being carried out by the UNFCCC. Lookout for yours, engage and influence others to do so, too.

Myself? I certainly became more sustainable in my practices. I have been supplied by 100% sustainable energy sources for the longest time in my life. I have reduced my food intake to healthier portions, adding my sand grain to mitigate soil exhaustion and LULCF. I also managed to influence some people to recycle and reuse, extending certain products’ life cycle and participating even further in the circular economy. I’ve recently calculated my carbon footprint, too. It’s 53% below the UK average.

The Northern Hemisphere summer holidays season has started. It’s a good time to do your balance and, if needed, reconduct your sustainable behaviour. Happy Sustainable holidays!


Unesco Arouca Global Geopark

Smart cities paving the way to a sustainable GDP?

Smart cities is an evolving concept. It has been developed progressively with private and public responsibility, transforming our urban areas so they become more attractive and liveable. Albeit isn’t a uniform definition, it’s commonly accepted that, at least, it lies on mobility, infrastructure, economic growth, health, environment, and governance. Citizens, both residents and visitors, businesses and governments are increasingly demanding places where infrastructure, services and technological reliability are high and adaptable. To deliver so, it is important not only to innovate but also to collect, treat and analyse good data.

Photo by Meruyert Gonullu on Pexels.com

During the Covid-19 pandemic priorities have changed. Having good health systems, technological infrastructures, and safe environments has become key. Lockdowns have pushed many to spend most of their time at home, restricting their mobility to very reduced geographic limits. As a way to escape the walls within which they have been confined, many started to put action on their long-postponed plan, explore those geographic limits. Tourism became more and more local, but not many businesses profited from this shift. The gain was on People’s welfare, which was enlarged by the decision of some to temporarily move to environments with better air quality and less density, being consequently less polluted and less contagious.This led to cost-savings for the Healthcare systems, overburdened by the Pandemic exponential demand for its services.

Awareness on environmental issues has raised during Pandemic, too. Studies done in 33 countries including top polluting countries such as China, USA, and India, show so. Probably triggered by the understanding of Covid-19 infection risk or by the benefits received while enjoying green spaces during lockdown time. The fact is that society is experimenting the benefits of preserving the Planet and cohabiting with a balance. More people, businesses and governments are willing to and have been shifting to e-mobility and procure sustainably, from the energy consumed at their premises to the growing paperless transactions; behaviours are changing to a larger extent.

Cities have gone through temporary exodus in 2021. This may lead to different scores from previous years on the several Smart Cities indexes, although their focus and methodologies are different, the reason for cities being ranked differently.

The welfare gains have been uncountable, for the time being. The third sequence of lockdowns attempting to contain the Covid-19 virus and its mutations’ spread could be the time for a Game Changer on Smart Cities. Perhaps a good criterion to be added to the multiple criteria that form the many Smart City indexes, is the cost-savings or the welfare gain the free, open air activities generate for Citizens, Businesses and Governments and that are increasingly appreciated by each one of these actors. Starting only with one of them may be simpler and can then pave the way to the long-waited change on the GDP factors, originating a sustainable GDP, GDP+. But this change cannot occur before having discussed and agreed a homogeneousness of the methodology to allow countries a fair comparison and ranking.

Isn’t this a good time for transparency on the estimated welfare?

Packaging waste

According to Statista, packaging generated 46% of worldwide plastic waste in 2018, followed by the textile sector, as illustrated below in the packaging waste by sector diagram gathered by Statista in 2021.

With the 18.75% surge on the global e-commerce sales during the 2020 Pandemic, as reported by the UN Conference on Trade and Development at the beginning of this month, the need for secondary packaging has moved alongside that surge. Alibaba, Amazon and other online resellers’ procurement departments may have been extremely busy ensuring packaging procurement wouldn’t be disrupted by the international trade restrictions imposed on supply chains due to the global and quick multiplication of Covid-19 infection. Amazon has even managed to deliver parcels within a few hours of ordering and added some extra paper layers inside those parcels, minimising the operational risk. The previous emerging trend of selling from bulk where consumers showed up in the store to fill their own container, may become a short-lived marketing and sustainable initiative, hindered by that global shock. When looking for the optimal solution between number of items packed, lead times and warehouse storage space, it seems the environmental footprint hasn’t been fully considered. Some online purchased items get home even with three layers of packaging, some of which cannot be reused, only recycled.

Given that more packaging ends in households along with their lower recycling rates when compared with stores’, possibly due to either lack of recycling culture, incentives or appropriated infrastructure, it is paramount to change so. The EU has been leading on the packaging recycling. Yet, there’s room for improvement. Currently only 66% of that waste is recycled, as can be observed in the Eurostat graphic below.

What can you start doing? Stimulate your circle of influence so other households can increase recycling volume and recyclable inputs in packaging can grow again. I know isn’t easy. But with creativity, we can achieve so. Play around, go for a walk, watch a film, exercise, talk, dream. One day an idea will come. It may not be by serendipity but through the process you have previously kicked off.

A 2020 Pew research study, Breaking the Plastic Wave, alerted for the current 11 million tonnes of plastic leakage into the ocean annually, 37.5% more than previous forecast. Have you considered in your next holiday to:

  1. Throw in the recycling bin the plastic used and no longer possible to be reused;
  2. If a plastic falls from your belongings carefully pick it and recycle it;
  3. Raise awareness of those around you for the volume of annual plastic leakage, that softly kills the biosphere;
  4. volunteering to help maintain clean the space you’ve travelled to, if local community isn’t sufficiently aware?
Photo by Catherine Sheila on Pexels.com

Isn’t that awful when you’re sold a trip to a paradisiac beach but when you get there, as the weather has dramatically changed, plastics and other type of litter were brought onshore? What about the micro-plastic that we ingest when we eat fish?

The above-mentioned Pew research study, illustrated in the graphic below, Plastic Leakage into the Ocean, calls the attention on the significance of tackling plastic leakage into the ocean. From the current 11 million tonnes per year, only bold actions will ensure a substantial reduction by 2040 of 54.5%. If we keep behaving unchangeably the plastic leakage into the ocean will raise by 172,7%. Hence, a systemic change is needed or we risk depleting the ocean along with increasing its acidification, which will affect the dependent ecosystems.

Plastic leakage into ocean scenarios by Pew Research study, 2020.

International Workers’ Day

Today, 1st of May, the large majority of countries celebrate the International Workers’ Day or May Day. A graphical representation of those, according to Wikipedia, is illustrated in the picture below.

The SDG 8 – Decent Work and Economic Growth reflect the origin of today’s celebration, the reduction of the 70+h working weeks to 8h/day in the XIX century. The World has come a long way since those days. More women have been included in the workforce, at all levels. The Women’s Bureau graphical representation below shows a convergence in the US workforce between 1945 and 2015. Although the USA has just elected Kamala Harris as its first female Vice-President and a few years ago, Janet Yellen was the first female leading the FED, there are some counties that have been following the opposite trend in the past 15 years.  During so, the world has seen a contraction on female representation in the workforce, stemmed from a significant reduction in the Asian-Pacific countries, as you can observe in the Our World in Data graphic below. Paid maternity leave became a reality and shared parenthood leave is becoming more normal, with Scandinavia leading on this particular progress.

Graphic 1 - USA share of male and female representation in the workforce between 1945 and 2015  Source: Women’s Bureau, US Department of Labor

Graphic 1 – USA share of male and female representation in the workforce between 1945 and 2015 Source: Women’s Bureau, US Department of Labor

Graphic 2 - World of female representation in the workforce between 1990 and 2017  Source: Our World in Data

Graphic 2 – World of female representation in the workforce between 1990 and 2017 Source: Our World in Data

In 2019 female participation has dropped to 47 % from 51% in 1990, which is aligned with overall human being representation in the workforce, as per World Bank’s graphics included below. The economic downturns along with an increase in aging population, the increase in life expectancy (hopefully reaching the 100 years life as the economist and Professor Andrew Scott, advocates) accompanied by the robotics’ usage, which improved significantly our well-being, may be the cause of this continuous drop verified in the past 15 years. The International Labour Organisation estimates that Covid-19 has caused an 8.8% of working hours loss, 400% more than during the 2008 financial crisis. Unfortunately, according to the ILO, job losses during the Pandemic were higher for women and young workers. For 2021, the job loss is expected to further contract by 3%.

Graphic 3: Female Representation in the Workforce      Source: World Bank

Graphic 3 – Female Representation in the Workforce Source: World Bank

 Graphic 4 - World's workforce participation. Source: World Bank

Graphic 4 – World’s workforce participation. Source: World Bank

During lockdown violence against women and girls has increased, and sometimes within the same gender, too. The UN estimates that gender domestic violence has increased by 30% during the Pandemic. The mistreatment of women accompanied by the heavier job losses women have faced during the Pandemic, just increase the gender gap. A retrocession that makes achieving SDG5, a bigger challenge than when it was initially set, back in 2015.

That leads us to the SDG 8, which aims at promoting “sustained, inclusive and sustainable economic growth, full and productive employment and decent work for all”. The Pandemic has shown lack of sustainable leadership, with several biases reflected in the unequal job losses and the PPE usage by mediatic leaders, who in their TV appearances and meetings at the crisis surge were not wearing a face-covering mask, yet demanding the population to do so.

2020 was an unprecedented year in many matters, including economic and health. Global GDP per capita is expected to drop by 4.2%, governments are spending unprecedentedly to cushion the economic downturn as much as their financial creativity allows them.

2021, offers an opportunity to rethink our lifestyles, our values and our traditional economic model. It’s time to recognise that men and women can contribute equally in the workplace and transit to the circular economy, which allows a sustainable growth for the People and the Planet.

Happy International Workers’ Day!

Energy Access

Have you realised that without energy we would be living in Wilma Flintstones’ world? From the mattress where you sleep, the pillow you rest your head, the sofa possibly overused in the past 14 months to the shoes you ware or the vaccination booking, all goods and services need energy to be used.

Energy is a basic good and its distribution, a basic need. Although great progress has been made since energy access data started to be collected in 1990 by the World Bank, as shown in the graphic below, not all have access to it yet. The last decade of the XX century experienced a rampant improvement in the energy access. Overall, energy access improved over 35 p.p. between 1990 and 2000. It occurred mainly in Latin America, Caribe, Sub-Saharan Africa and South Asia. World leaders ensured the World started the XXI century with more comfort than it began. But unfortunately, that comfort has been accompanied by extra GHG emissions as the chosen energy systems were not the most environmentally friendly. Progress came at a cost.

As we progress in the XXI century a new system is emerging. The dialog amongst civil society, businesses and governments is becoming more inclusive in solving global problems such as mitigating climate change negative impact. The transformation many sectors need to pursue is being pulled by the strength of those three actors and the urgency to act deeply to decarbonize and limit global warming to 1.5ºC or 2ºC. Although The Economist informed this week that an yearly volume of 5.5GtCO2 emissions haven’t been taken into consideration by countries, just same volume as the second most pollutant country, due to the varied reporting standards adopted by different countries. With this new data, our Carbon Budget for our Planet’s average temperature not to be risen above the limits agreed with the Paris Agreement, is most certainly smaller than has been announced.

In the previous century, a country’s typical energy mix was comprised of natural gas, oil, coal, hydro, nuclear and a insignificant presence of renewables. As technologies developed, global warming became more evident, pollution levels rose along with respiratory diseases, action to tackle this societal problem emerged stronger. Consequently, renewable investments have been increasing as shown in my post Energy Transition investments.

It’s great to see this increasing portion of renewable energy being generated and consumed. Yet, this increasing rate causes extra pressure in the national energy system operators. The uncertain nature of the renewable energy generation, that not always generates what is expected due to weather changes and the need to meet the electricity demand makes the grid balance to ensure the system’s reliability, more challenging. For each one of us to switch on the power anywhere and anytime, without disruption, system operators need to ensure electricity is generated, transmitted and distributed in the correct amount and at the right tension.

Integrating the new distributed systems in the traditional model is a challenge that will be overcome, in many parts of the world, with a collaborative action from civil society, businesses and governments.  

P.S. The previous graphic wasn’t showing the % of population with energy access. The current one is the correct. Yet, this does not change the fact that population has had a more comfortable life with an increase of energy access. The number of countries with energy access has been growing for the past 3 decades, and although the last quinquennium of XX century more population were deprived of energy access, that trend started to revert as the new century and millennium began.

Closing the Loop – Screening the Documentary

About this Event

Closing the Loop, an award winner Circular Economy documentary by Wayne Visser. SustainAbility in Habit founder, Filipa Ferreira will screen Freely this Sunday via Zoom at 15h00 GMT/16h00 CET. It will be followed by a short chat with participants to share thoughts and quick reflections. Documentary lasts 1h30 and chat 30 minutes of discussion.

Watch the Trailer.

Event details will be received once registered. Registration is FREE!

Circular Economy and the Circular Economy Commitment

Circular economy is gaining strength as the linear business models have been proving unsustainable. Increasingly more companies are adopting the Circular business models, with some also signing public Circular Economy commitments. Last week some have done so within the Sustainable Transformation groups. To learn more about Circular Economy and the Circular Economy Commitment you can listen to this podcast where I have interviewed Professor Dr Wayne Visser, a pioneer on Sustainability and Circular Economy research.  

Energy Transition investments

High-voltage electricity transmission lines and poles.
Photo taken by Filipa Ferreira

Global investments in energy transition increased by 9%, reaching over $500 billion in 2020. Although investments in Renewable energy grew by 2% from 2019 levels, the surge stemmed from investments that will enable Electric vehicles to be used in the near future. A record year for EV investments with an 28% surge, as BNEF points out in its Energy Transition Investments Report.

Renewable investments continue to be made in the infinite natural resources of solar irradiation and wind. Investments in Biomass have decreased, showing a better alignment with the Paris Agreement goals and the need to invest in assets that limit global warming to 1.5ºC by 2030.

On the corporate sector, organisations have been also actively taking part in the energy transition, as illustrated in the graphic below, collected by Statista from BNEF data. As it can be observed, signing Paris Agreement has been key in this transition. In 2017 corporate PPA investments surged by 44%, in 2018 by 119% and 2019 by 43%. Geographically, the USA has been leading on corporate PPA’s investments.

Global Corporate PPAs historic investments from 2008 to 2019
Source: Statista and BNEF

Despite all clean energy investments made so far, more are still needed to ensure demand is met by cleaner sources. In 2020, OECD still generated 54.7% of electricity from fossil fuels, data from IEA shows. Renewable generation only grew by 4%. Only OECD data is revealed as at the moment, data from the rest of the world isn’t available.

Economic activity can take its normal course uninterruptedly, if the energy network that sustains it is reliable. Currently, reliability to ensure that security of supply is still an issue, as neither sun nor wind are continuously available or when consumers mostly need it. For example, electricity storage investments in 2020 remained unchanged from 2019, as per BNEF’s report. If there’s capacity to produce but no capacity to store when its cost is lower, an opportunity may be wasted.

To reduce that waste and help balancing the electricity system, options are available. At industrial level, demand response is widely available and G2V-V2G is emerging along with renewable energy installations for self-consumption, as the above graphic shows. On the domestic side, consumers are increasingly installing energy-efficient appliances. BNEF indicates a 12% increase in 2020. Prosumers are also on the rise. But to optimise energy assets, either big or small, professionals will be needed.

International Forest Day

To celebrate the International Forest Day, under the international theme “Forest Restoration, a path to recovery and wellbeing”, the Portuguese Government has decided to offer about 50,000 trees to be planted at citizens and NfP premises. So I’ve decided to do some research and calculate the approximate carbon sequestration those trees offered would have. Do you want to know? Listen to this podcast episode…